AlphaTRADER Academy
Mastering the Wyckoff Accumulation
Large institutions—the "Smart Money" or the Composite Man—cannot simply buy millions of shares at once. They must silently accumulate their positions over weeks or months. Richard Wyckoff discovered how to track their footprints.
The Composite Man
Wyckoff proposed a heuristic: imagine that all market operations are orchestrated by one entity—the Composite Man.
- He plans, executes, and concludes his campaigns carefully.
- He absorbs supply (retail selling) at wholesale prices.
- He tests the market to ensure all sellers are exhausted before marking up the price.
Retail vs. Smart Money
While retail traders sell in panic during prolonged downtrends, the Composite Man is quietly buying every dip, absorbing the liquidity.
The 5 Phases of Accumulation
Click through the phases to understand the mechanics of the schematic.
Spot the Spring (Phase C)
The Spring is the ultimate bear trap. The Composite Man pushes the price below the trading range support to hunt retail stop-losses and ensure no floating supply remains before the markup.
Where is the Spring on this chart?
COT Confirmation
The Commercials in the Commitment of Traders (COT) report are the physical embodiment of the Composite Man. During Phase B and C, you should see Commercials building net LONG positions.
Check COT Index DataSentiment & Retail Crowding
A true Spring (Phase C) occurs when Retail traders are overwhelmingly SHORT, convinced of a breakdown. Look for Retail Short positioning >75% to confirm the bear trap.
Check Retail SentimentWyckoff Glossary (Hover to Reveal)
Execution Checklist
Historical Examples (Gallery)
See how the Wyckoff Accumulation schematic played out in real market conditions.

Bitcoin (BTC/USD) - 2015
Textbook 6-month accumulation before the 2017 bull run.

S&P 500 - March 2020
A rapid Phase A and B, typical for V-shape institutional buying.
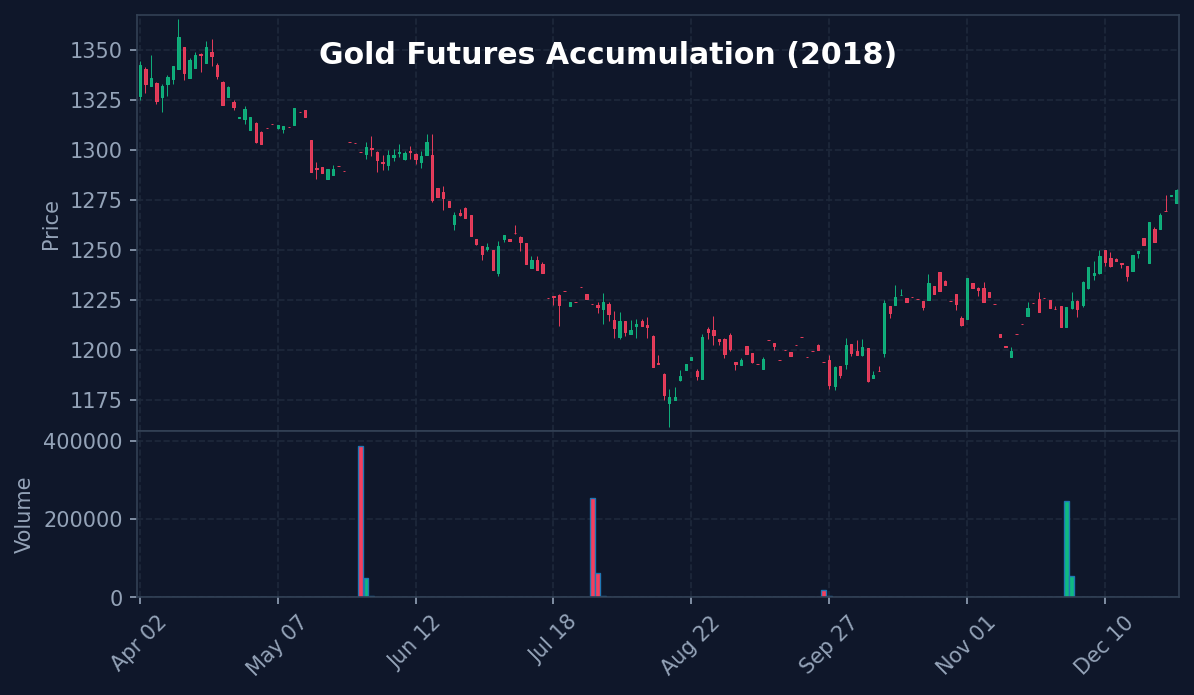
Gold (XAU/USD) - 2018
Extended Phase B building the cause for the 2020 breakout.
Test Your Understanding
5 questions — instant feedback, no scoring stored.