AlphaTRADER Academy
Re-Accumulation & Re-Distribution
The most expensive trader mistake: shorting a Re-Accumulation thinking it's a Distribution top. Or buying a Re-Distribution mistaking it for a bottom. Same shape — opposite outcome.
"A trend in motion stays in motion until proven otherwise. The Composite Man pauses to reload, not always to exit."
Schematic Position in Trend
| Criterion | ||
|---|---|---|
Phase Identifier Challenge
INTERACTIVE
Decision Flowchart — Is This Re-Acc or Distribution?
A 30-second filter you can run on any sideways range you encounter.
COT Position Continuity
The biggest tell: during a true Re-Accumulation, Commercials are still holding net long from the original accumulation — they don't flip. If COT shows Commercials reducing longs aggressively, the range is more likely a top.
Check COT ContinuityHigher-Timeframe Bias
Always check the higher timeframe before labeling a range. A daily Re-Accumulation lives inside a weekly uptrend. If the weekly is sideways or rolling over, your "Re-Acc" might just be a regular distribution.
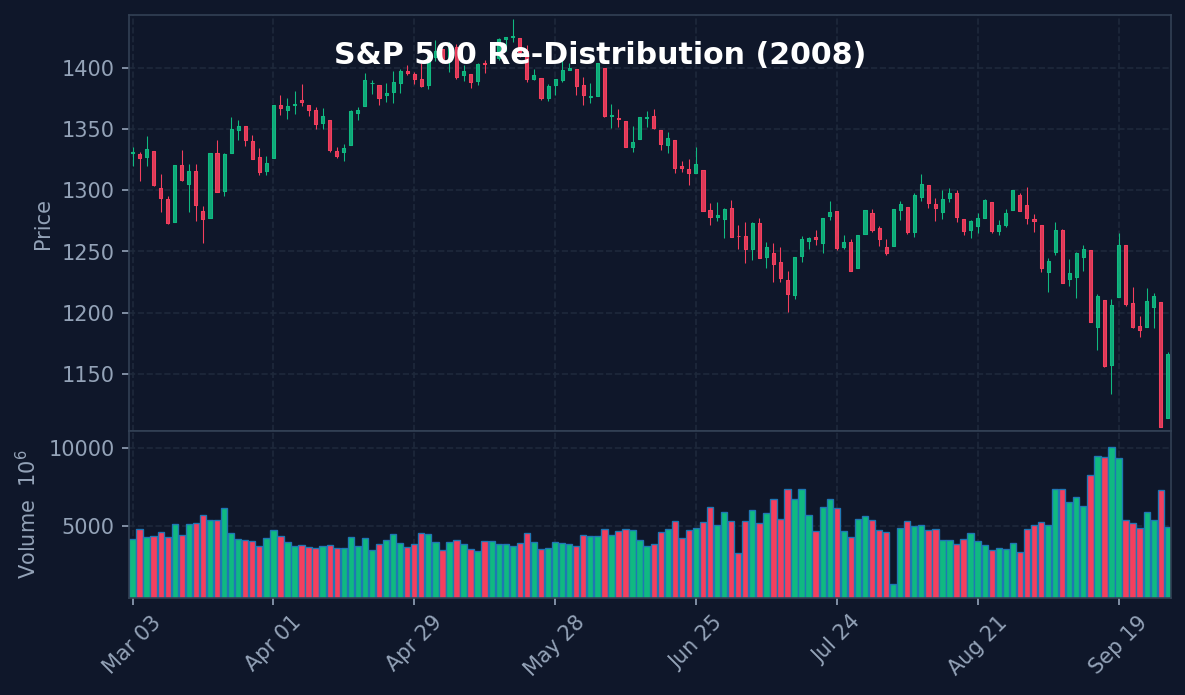
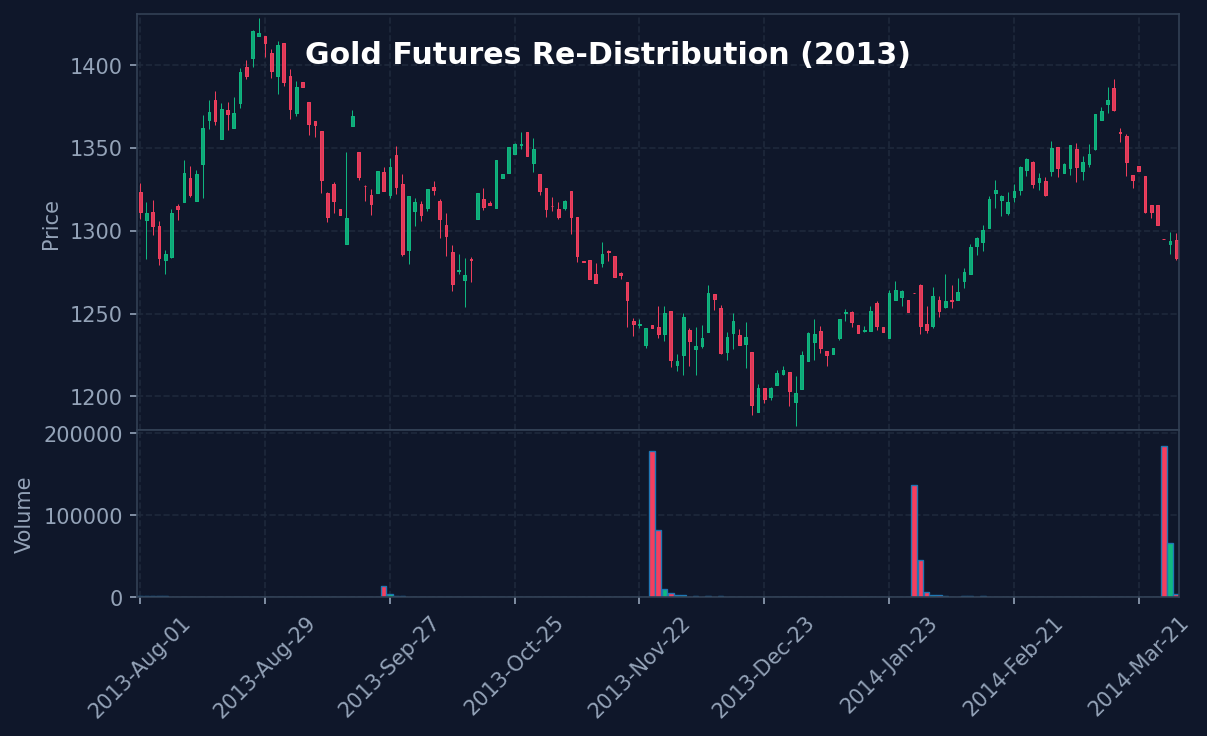
Open DashboardHistorical Examples (Gallery)


Test Your Understanding
4 questions — instant feedback, no scoring stored.