AlphaTRADER Academy
Mastering the Wyckoff Distribution
After a prolonged bull market, institutions need to unload their massive positions without crashing the price immediately. They create a "ceiling" to trap retail buyers in FOMO before the inevitable markdown.
The Composite Man — Exit Mode
Distribution is the mirror image of accumulation. The same Composite Man who quietly bought at the lows now needs liquidity to sell into. Retail euphoria provides it.
- He distributes supply (sells inventory) at retail prices, into FOMO buyers.
- He engineers fake breakouts (Upthrusts) to harvest stop-buy liquidity above the range.
- He tests demand to confirm no real buyers remain before triggering the markdown.
Euphoria = Liquidity
When mainstream media shouts "new all-time high" and your taxi driver gives stock tips, the Composite Man is selling every single share into the crowd's enthusiasm.
The 5 Phases of Distribution
Click through the phases to understand how institutions distribute their holdings.
Spot the UTAD (Phase C)
The Upthrust After Distribution is the ultimate bull trap. The Composite Man pushes price above the trading range resistance to harvest buy-stop liquidity and lure breakout traders, then dumps inventory into the rally.
Where is the UTAD on this chart?
COT Confirmation
Inverse of accumulation: during Phase B and C, the Commercials should be aggressively building net SHORT positions, while Large Speculators (trend-followers) reach extreme net LONG exposure.
Check COT Index DataSentiment & Retail Crowding
A genuine UTAD (Phase C) prints when Retail traders are overwhelmingly LONG, convinced of an endless rally. Look for Retail Long positioning >75% to confirm the bull trap.
Check Retail SentimentDistribution Glossary (Hover to Reveal)
Execution Checklist
Historical Examples (Gallery)
See how the Wyckoff Distribution schematic played out before major historical tops.
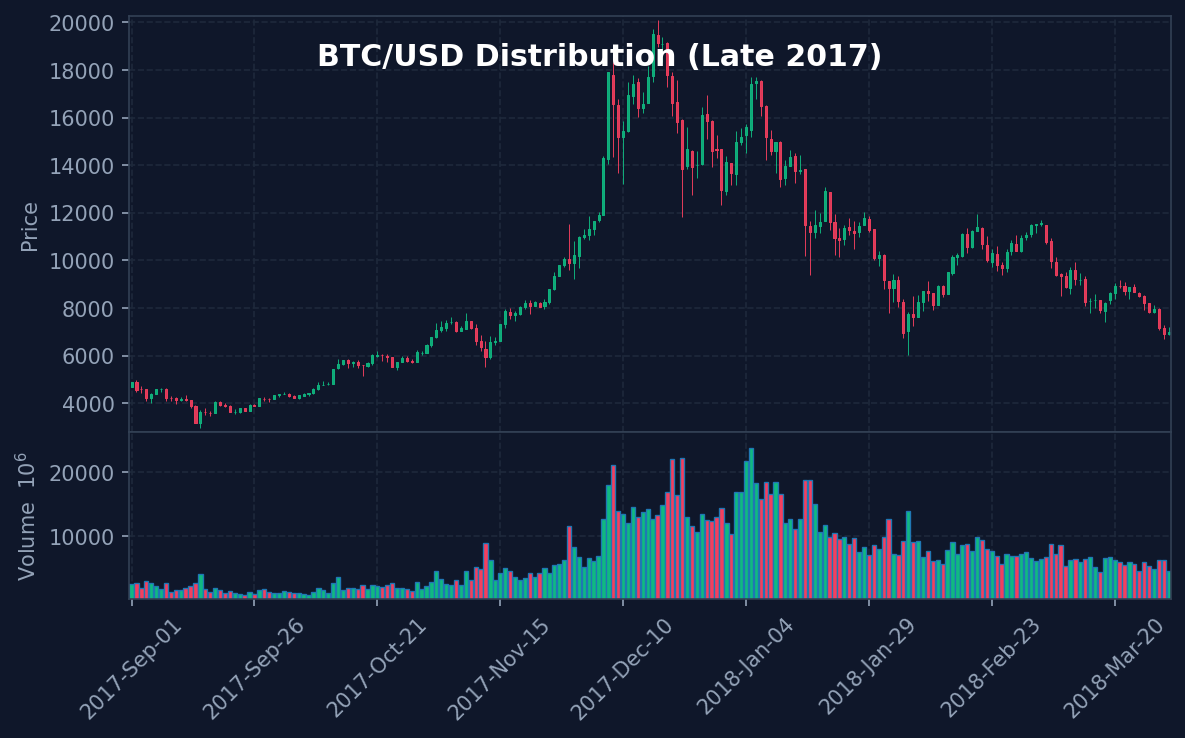
Bitcoin (BTC/USD) — Late 2017
Textbook UTAD at $19,800 print before the multi-year bear market.
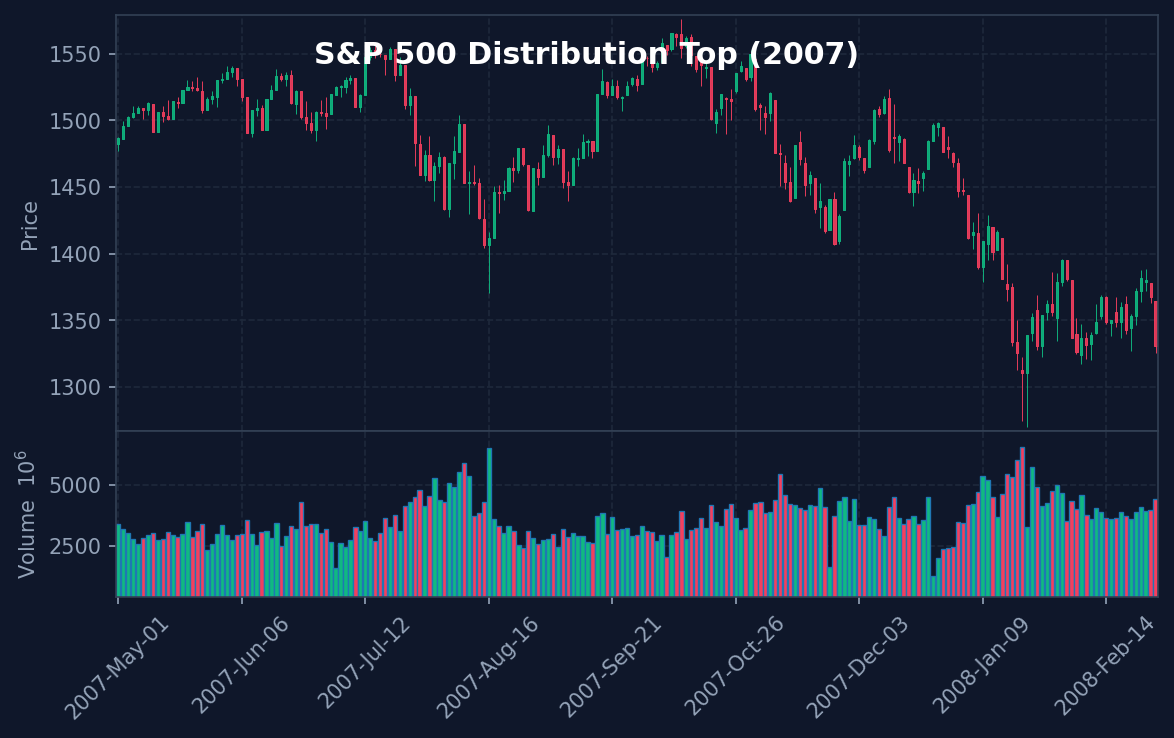
S&P 500 — 2007 Top
Six-month distribution range before the Global Financial Crisis markdown.
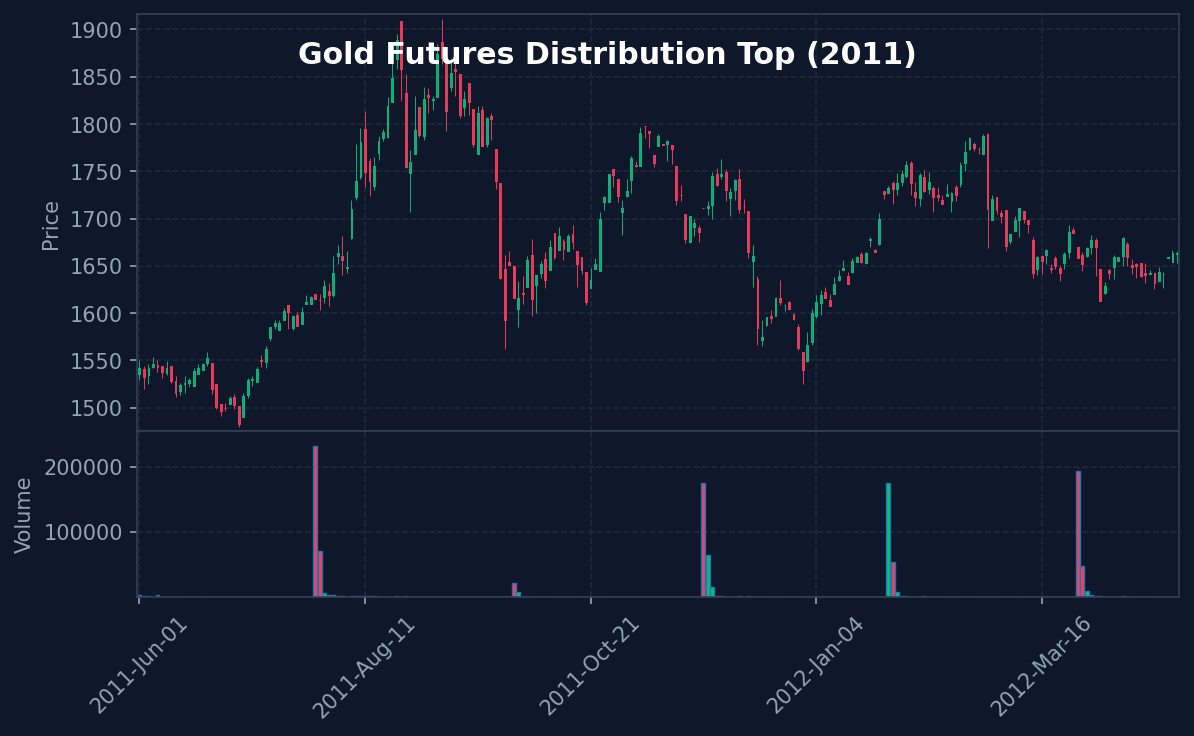
Gold (XAU/USD) — 2011
Parabolic blow-off into $1,920, then distribution and the start of a 4-year decline.
Test Your Understanding
4 questions — instant feedback, no scoring stored.